Press Release
COVID-19 Measures Dramatically Reduce Road Traffic and Congestion
• Globally, movement restrictions prove to be the best measure to prevent the spread of COVID-19
• Search for data-points to measure the impact of this never-before global pandemic
• Dramatically reduced road traffic gives credit to authorities’ efforts and to compliant motorists
• Essential traffic enjoys greatly reduced congestion during their vital services
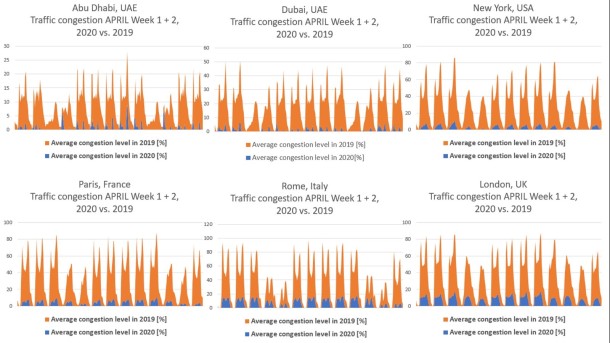
Dubai 19-April, 2020; TomTom, the leading independent location technology specialist shared with RoadSafetyUAE traffic data of selected key global cities to validate the dramatically reduced road traffic due to the introduction of vitally important movement restrictions aimed to stem the spread of COVID-19 infections.
In these unprecedented times, stakeholders grapple to find measures to describe the impact of the never-before global pandemic. By using its ‘Traffic Index Congestion Level Data’, TomTom is uniquely positioned to provide real-time traffic density data for analyzing the impact of movement restrictions. The following key cities have been selected to illustrate the changes in road traffic and congestion patterns: Dubai, Abu Dhabi, Paris, London, Rome and New York.
Thomas Edelmann, Managing Director of RoadSafetyUAE states: “It is fascinating to see the impact of the vital measures taken by authorities around the world and also the obvious compliance of road users. From a road safety perspective, it is wonderful to see that the dramatically reduced congestion keeps the roads free for the providers of vital services. It is encouraging to witness the compliance of road users in these challenging times we sincerely hope that the mindset of responsible conduct will prevail also once we will return to ‘normality’ on our roads. The safety of all individuals and the society must always be our number one concern.”
Coverage for example in Gulf News https://gulfnews.com/uae/transport/coronavirus-comparing-uae-traffic-before-and-after-covid-19-1.71059676
Check out the full data in our Topic Statistics, or access the excel sheet directly


